|
<< Click to Display Table of Contents >> Dashboards |
  
|
|
<< Click to Display Table of Contents >> Dashboards |
  
|
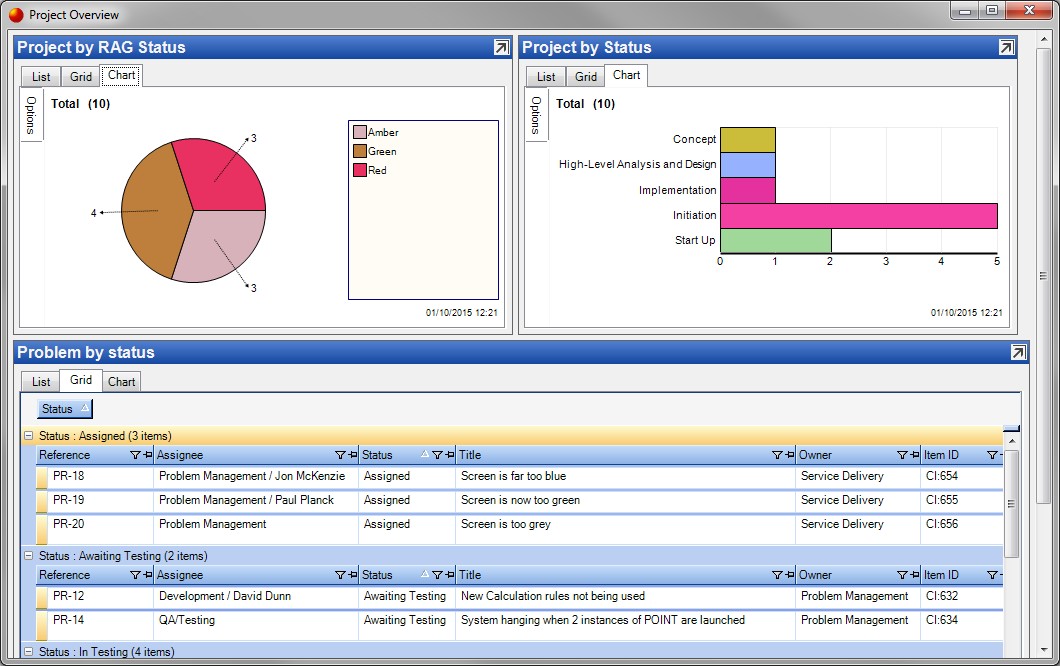
Cimera provides the ability to group a number of existing queries together to form a dashboard

The dashboard has a flow layout and a query will appear next to the previous query unless there is insufficient space in which case it will appear below the previous query.
The ![]() icon at the top right of each query element opens the underlying query for editing in a new window. Any changes to the query may, of course, only be saved by sufficiently authorised users.
icon at the top right of each query element opens the underlying query for editing in a new window. Any changes to the query may, of course, only be saved by sufficiently authorised users.