|
<< Click to Display Table of Contents >> Reporting DB and Charts |
  
|
|
<< Click to Display Table of Contents >> Reporting DB and Charts |
  
|
The Chart groups and aggregates data as described here.
However, the Reporting DB SQL may return data that has already been summarised and the chart will attempt to identify this and give appropriate options.
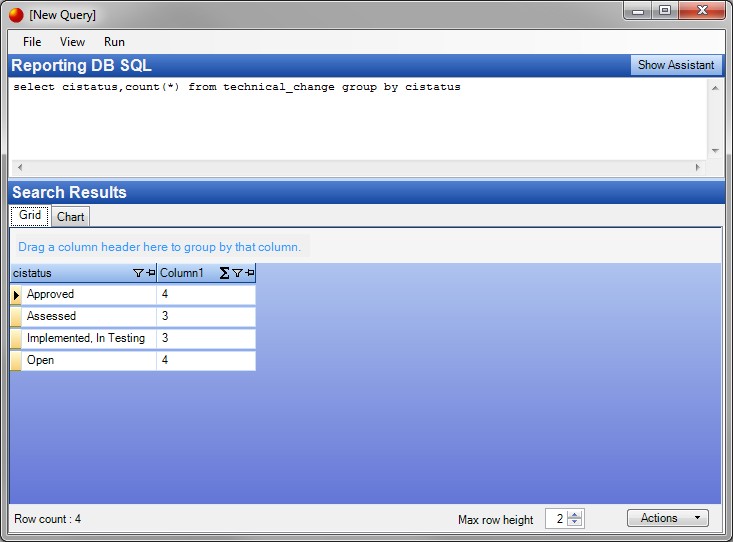
The query below returns two columns, the first is a group and the second is the related count.

Switching to the Chart view there is a new option of Source Data Format which defaults to Unsummarised data. As the data has two columns and the second column is numeric the Chart also offers Summary by col 1. Selecting this option uses the summarised data:

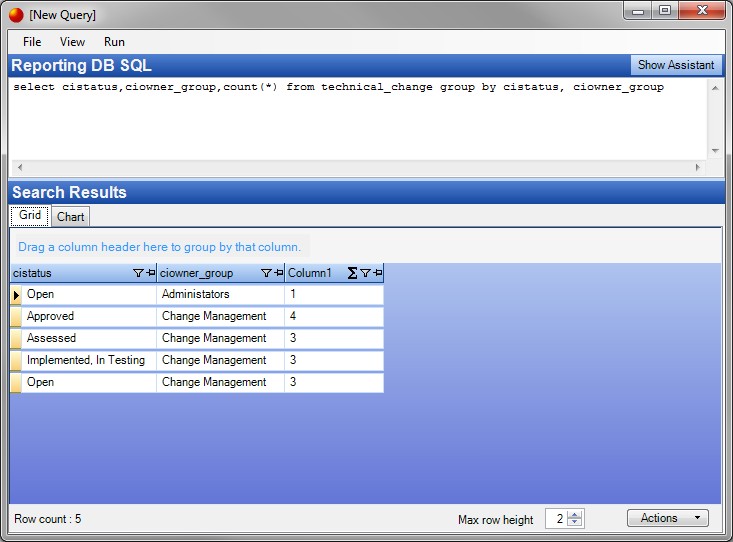
Changing the query to group by two columns:

The chart detects that there are three columns and that the third is numeric and so offers Summary by cols 1 and 2.
