|
<< Click to Display Table of Contents >> Chart |
  
|
|
<< Click to Display Table of Contents >> Chart |
  
|
The Chart may be used to group and aggregate items.
The chart may be presented in its own window or as a tab in the Query Results pane (see Query Window)
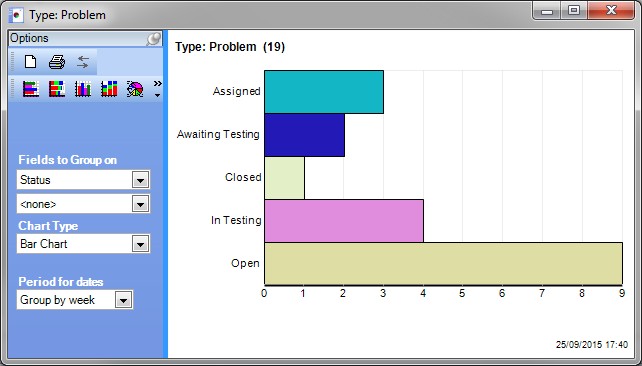
By default the chart groups the items by Status on a bar chart.
The options on the left hand side give the option to
| • | Group by any field on the items |
| • | Sub group by any other field |
| • | Change the type of graph used |
| • | If the chart is displaying the items grouped by a date field, then the date grouping period can be changed |
Selecting any segment of the chart will open a list of the items included within that segment
For example clicking the In Testing section will open up an Item List displaying the 4 items being tested

The Chart is also used to display results from the Reporting Database however there are some important differences as the reporting database queries may already return summarised (grouped and aggregated) data. See Reporting DB and Charts
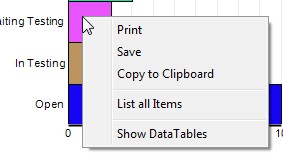
Right-clicking in the chart area will present a context menu

The List all Items option is the equivalent to left-clicking a chart bar but will not appear if the chart has been generated from the Reporting Database.
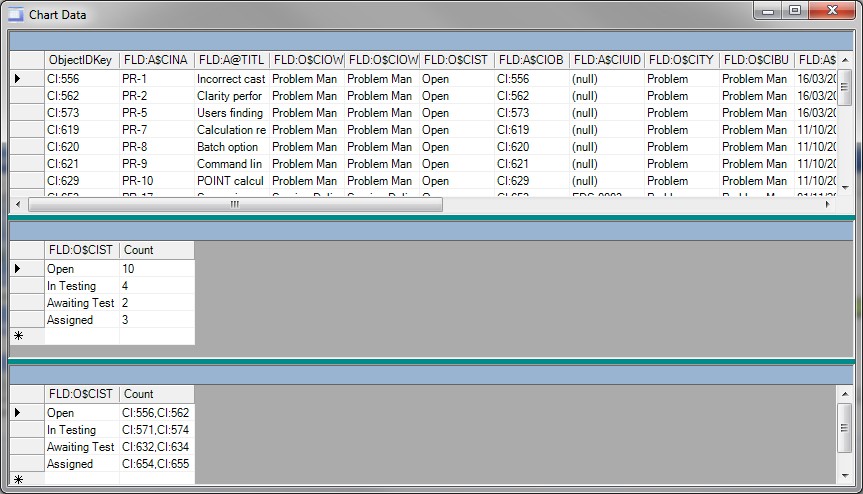
The Show Data Tables option will only appear if the user is an administrator and is operating in Admin Mode. It will show the underlying data tables which can be useful when trying to understand why the expected results have not been generated:

The first table is the raw data, the second table is the summarised data (in this case grouped by Status) and the third table shows the list of object ids in each summary item.