|
<< Click to Display Table of Contents >> Dashboard Editor |
  
|
|
<< Click to Display Table of Contents >> Dashboard Editor |
  
|
The dashboard editor is accessed by either selecting to edit an existing dashboard (see Manage Dashboards) or from the main Cimera window Menu Dashboard > New Dashboard.

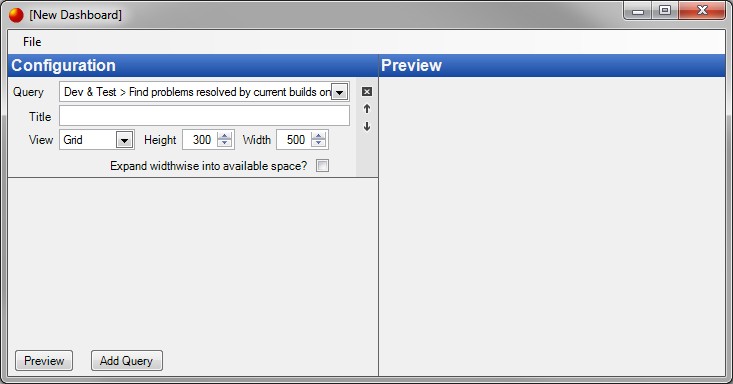
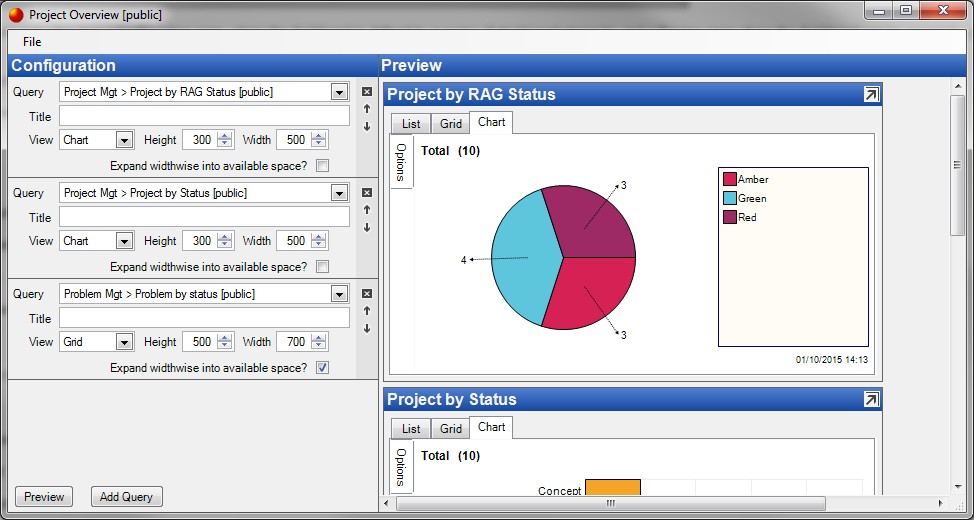
The dashboard editor has a Configuration pane, where the dashboard is defined by a series of dashboard elements, and a Preview pane where the dashboard can be viewed (by pressing the Preview button).
By default one dashboard element is added to the new dashboard. Additional elements may be added by pressing the Add Query button.
Dashboard elements are ordered or deleted using the buttons on the right hand side:
![]()
The x button removes the element and the arrow buttons move the element up and down the list of elements.
Each dashboard element corresponds to an existing query which is then configured;
Select an existing query
The title of the dashboard element defaults to the title of the query however it may be overridden
Which view the query should be displayed using: List, Grid or Chart. Note: List is not applicable for Reporting DB queries.
Height of the element in pixels
Width of the element in pixels
If this option is checked then the width is treated as a minimum width and the element will expand to use all available width
Pressing the Preview button allows checking the dashboard to make sure that all of the elements are appropriately sized.
